Grafana Server Setup
Grafana is an amazing server application that can give insight, alerting, and many metrics on infrastructure. Grafana is incredibly easy to setup and this post will go over how to install this application. The commands are referenced from here.
Setup Commands
To install Grafana Server run the following commands.
wget -q -O - https://packages.grafana.com/gpg.key | sudo apt-key add -
echo "deb https://packages.grafana.com/oss/deb stable main" | sudo tee -a /etc/apt/sources.list.d/grafana.list
sudo apt-get update
sudo apt-get install -y grafana
sudo systemctl enable grafana-server
sudo systemctl restart grafana-server
First Login
Navigate to the server at port 3000 to get to the login page. You can login with the username admin and password admin.
http://serverip:3000

Connect to Prometheus
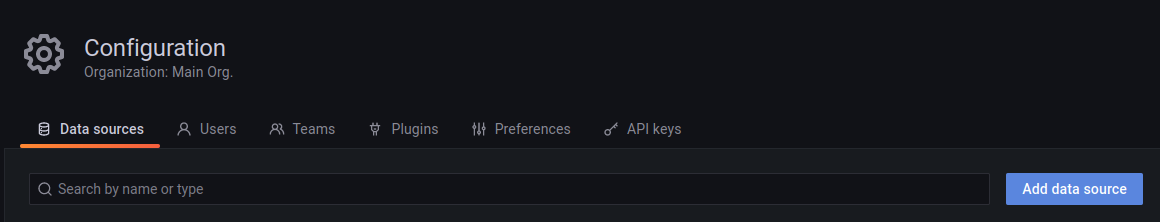
Once you login for the first time, if you followed my post about installing Prometheus and Node Exporter, you can add in that dataset to Grafana. First click the gear on the left side.

Then click “Add data source”.
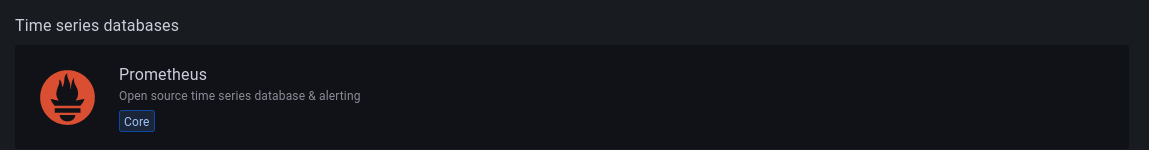
Then choose “Prometheus”.
Make sure to update the URL to the host you installed Prometheus on. You must retype localhost here if using it because it won’t assume for you if you don’t type in this text box.

Now at the bottom click “Save & test”. You should see all green if configured correctly.

Next Steps
From here we have our metrics getting to Grafana. The last step in this journey is getting the node_exporter dashboard setup which will be a later post.